To Customize Revenue or Assets in the Salaries by Experience/Size Table
| 1. | From the Salaries by Experience/Size table: Click the Customize button below Years of Experience, Revenue, Assets, Fiscal Year Budget (FYB), or # of Employees (depending on the column 1 value type). This will take you to the Customize Table dialog box. |

| 2. | Depending on the column 1 value type (Experience, Revenue, Assets, Fiscal Year Budget, or # of Employees): |
•To Display the Default Table: Click on the Show Default button.
•To View Data for All Years of Experience: Click the Show All button.
•To Delete a Value/Row: Select a row in the table and click the Delete button. A minimum of three (3) values must be displayed.
•To Clear All Values: Click the Clear All button and reenter a minimum of three (3) new values that fall in between the range minimum and range maximum values available.
| 3. | Click the OK button to return to the Salaries by Experience/Size table. |
| 4. | The box next to Customized Table will now be checked. To display the default table, deselect the Customized Table check box. |
Please note: If Show Customized X-Axis is selected (see the Annual Base Salaries Graph button), then the values on the X-Axis of the Salary Graph will be equal to the values in the first column of the table.
Column 1 values in the Salaries by Experience/Size table may represent Years of Experience, Revenue, Assets, Fiscal Year Budget, or # of Employees depending on the job title and the industry code.
To Customize Revenue or Assets in the Advanced Reports Table
| 1. | From the Advanced Reports table: Click the Customize button below Revenue/Assets. This will take you to the Customize Table dialog box. |
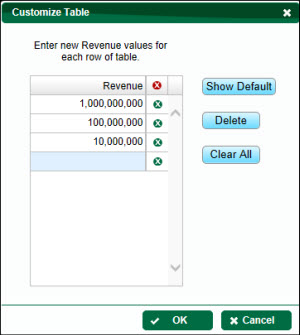
| 2. | Enter new Revenue or Assets values (depending on the industry code selected) for each row of the table: |
•To Display the Default Table: Click on the Show Default button.
•To Delete a Value/Row: Select a row in the table and click the Delete button. A minimum of three (3) values must be displayed.
•To Clear All Values: Click the Clear All button and reenter a minimum of three (3) new values that fall in between the range minimum and range maximum values available.
| 3. | Click the OK button to return to the Advanced Reports table. |
Please note: Only those jobs with salaries reported by Revenue or Asset size will display these values in the Advanced Reports table.
Background Information
ERI collects data with the use of two-dimension tables. For executive jobs, compensation is compared against the size of an organization (reflecting the fact that larger organizations pay their management more because of their greater responsibilities). For other jobs, rather than record five jobs for just one (such as clerk apprentice, clerk junior, clerk, clerk senior, clerk lead) as is the case with many surveys, ERI plots the requisite median experience for each of these levels and records the data as that of one job over a series of Years of Experience. As of 2015, ERI has added the ability to analyze compensation for non-executive jobs by a second variable, revenue, due to an increase in the volume of data collected.
See Salaries by Experience/Size Background for more information.
To Customize Years of Experience
See Customize Years of Experience
To Customize Levels
See Customize Levels
To Modify the Table
See Modify Table