To Customize the Organization Size Displayed in the Individual Profile Table
| 1. | Click the Customize button below Revenue, Assets, Fiscal Year Budget, or # of Employees (depending on the column 1 value type). This will take you to the Customize Table dialog box. |
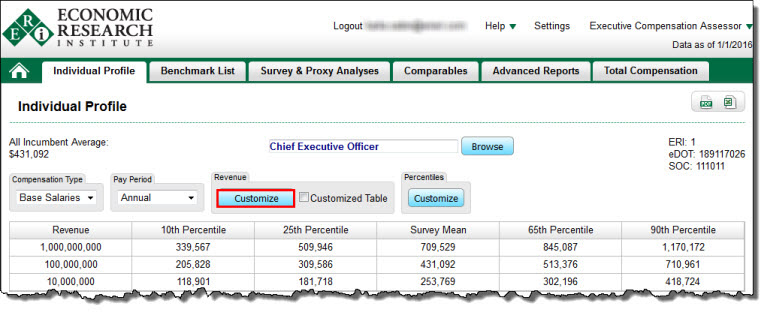
| 2. | Depending on the column 1 value type (Revenue, Assets, Fiscal Year Budget, or # of Employees): |
•To Display the Default Table: Click on the Show Default button.
•To Delete a Value/Row: Select a row in the table and click the Delete button. A minimum of three (3) values must be displayed.
•To Clear All Values: Click the Clear All button and reenter a minimum of three (3) new values that fall in between the range minimum and range maximum values available.
| 3. | Click the OK button to return to the Individual Profile table. |
| 4. | The box next to Customized Table will now be checked. To display the default table, deselect the Customized Table check box. |
Please note: If Show Customized X-Axis is selected (see Annual Base Salaries Graph), then the values on the X-Axis of the Base Salary Graph will be equal to the values in the first column of the table.
Column 1 values in the Individual Profile table may represent Revenue, Assets, Fiscal Year Budget, or # of Employees, depending on the industry selected.
Background Information
ERI collects data with the use of two-dimension tables. For executive jobs, compensation is compared against the size of an organization (reflecting the fact that larger organizations pay their management more because of their greater responsibilities).
Graph Notes: Please note that customizing the table (adding, deleting or changing rows, specifically the organization size shown in the first column) will also automatically change the graph. By default the range of values on the bottom axis of the graph corresponding to organization size (revenue) is set to show $10,000,000 to $1,000,000,000, but the XA database includes organizations with revenues of $1,000,000 to $100,000,000,000. Please use the Customize button to modify and/or add new values to change the bottom axis values and create a "wider" or "narrower" graph.
To Delete One or More Table Rows
To Sort a Table
See Sort Table