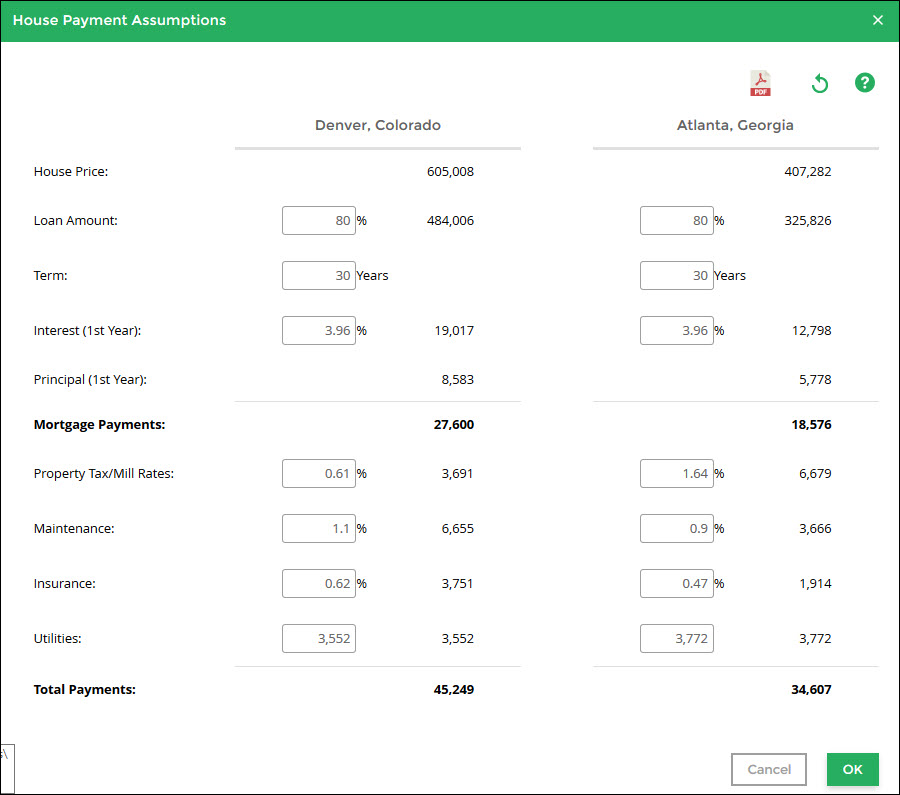
To View Housing Assumptions
| 1. | From the Two City Comparison, select Own in the Own or Rent field under in the Housing field in the Options panel. |
| 2. | Click the Housing Assumptions button in the Options panel to open the House Payment Assumptions dialog. |
To Modify Housing Assumptions
1.Click on any value displayed in a box that you want to change in the House Payment Assumptions dialog.
2.Type in the new value.
3.Click anywhere outside of this field to enter this value OR press Enter.
4.To return to the default values for all fields, click the  button.

House Payment Assumptions may be reviewed and modified separately for both the current base and destination cities. User modifications will impact the Two City Comparison table calculations only.
The House Payment Assumptions may be used to present a more accurate view of the current annual mortgage payment. By adjusting the Loan Amount and Term remaining for a specific individual’s current financial situation, a more accurate estimated yearly payment can be calculated. Default Interest rates are set to be equal, but may also be customized to reflect individual circumstances.
Example of Amortization Schedule Year 1: Loan Amount = $500,000, Mortgage Interest Rate = 4.5% |
|||||
Payment |
Principal Paid |
Interest |
Total |
Balance |
|
Month 1 |
$2,533.43 |
$658.43 |
$1,875.00 |
$1,875.00 |
$499,341.57 |
Month 2 |
$2,533.43 |
$660.90 |
$1,872.53 |
$3,747.53 |
$498,680.68 |
Month 3 |
$2,533.43 |
$663.37 |
$1,870.05 |
$5,617.58 |
$498,017.30 |
Month 4 |
$2,533.43 |
$665.86 |
$1,867.56 |
$7,485.15 |
$497,351.44 |
Month 5 |
$2,533.43 |
$668.36 |
$1,865.07 |
$9,350.22 |
$496,683.08 |
Month 6 |
$2,533.43 |
$670.86 |
$1,862.56 |
$11,212.78 |
$496,012.22 |
Month 7 |
$2,533.43 |
$673.38 |
$1,860.05 |
$13,072.82 |
$495,338.84 |
Month 8 |
$2,533.43 |
$675.91 |
$1,857.52 |
$14,930.34 |
$494,662.93 |
Month 9 |
$2,533.43 |
$678.44 |
$1,854.99 |
$16,785.33 |
$493,984.49 |
Month 10 |
$2,533.43 |
$680.98 |
$1,852.44 |
$18,637.77 |
$493,303.51 |
Month 11 |
$2,533.43 |
$683.54 |
$1,849.89 |
$20,487.66 |
$492,619.97 |
Month 12 |
$2,533.43 |
$686.10 |
$1,847.32 |
$22,334.99 |
$491,933.87 |
Mortgage Payments |
$8,066.13 |
$22,334.98 |
$30,401.11 |
||
Note: Slight differences in calculations due to rounding |
|||||
Property Tax/Mill Rates are estimated for individual locations based on published data and phone research to individual city tax departments. While the estimate can never be 100% accurate without the specific address of a home, ERI data analysts engage in the time intensive research to obtain city-level and, when applicable, neighborhood-level average rates.
Estimated Maintenance expenses are reported using research from home builder and home remodeler associations' figures and weather data.
Home Owner’s Insurance is estimated at the local level using industry association data and proprietary research on average Home Owner’s 2 (HO-2) policy costs. HO-2 refers to basic homeowners, and it covers dwelling and personal property against 11 perils, plus six more: falling objects; weight of ice, snow or sleet; 3 categories of water-related damage from home utilities or appliances; and electrical surge damage.
Annual Utilities estimates are reported using data and research from large utility providers. Regional and local percentage distributions of estimated combined uses of electricity, natural gas, heating oil, and propane as primary/secondary/tertiary home energy sources are calculated. Utility price-level indexes are applied to each source of energy data to compare different pricing patterns and costs.
This table breaks down the calculation of the Housing/Util/Prop Tax row in the Two City Comparison table. The final values, Total Payments, at the bottom of the House Payment Assumptions are the values shown in the Housing/Util/Prop Tax row on the Two City Comparison table.
To Export Housing Assumptions to PDF
See Export to PDF
To Change the Estimated Home Value
See Estimated Home Value.