QUESTION: What is the difference between the Local and National Expenditure pattern?
ERI researchers constantly study the effect on expenditure patterns of the high (and ever climbing) rents and home prices in desirable cities with plentiful jobs and wage growth. Detailed analysis has allowed us to refine the Local and National Expenditures Patterns and adjust the benchmark square footage in each location for each Annual Earnings level. As rents and home prices increase, a higher percentage of annual earnings is spent on housing, and, on average, a smaller living space (with fewer square feet) is affordable.
The Two City Comparison of the Geographic Assessor uses these default settings: Base City of the United States Average, Annual Earnings of $50,000, and home size of 1,613 square feet. Refinements to Local Expenditure datasets allow each Base location to have an individualized benchmark housing size to better reflect local housing costs.
Sample screenshots help illustrate the changes. In Screenshot 1, we show the United States National Average as the Base City, with the benchmark default of 2,200 square feet compared to the Destination of Los Angeles. In Screenshot 2, with Denver as the Base, the local expenditure pattern benchmark for earnings of $50,000 falls to 1,200 square feet. Using San Francisco as the Base (Screenshot 3) results in the rental size dropping to 649 square feet to reflect the very high rental costs. When the lower cost city of Indianapolis is the Base (Screenshot 4), the benchmark is 1,614 square feet (very slightly higher than the United States Average). Please note, these screenshots use April 2020 data, so future datasets will have slightly different square footage based on that release’s local expenditure pattern.
Screenshot 1 Screenshot 2 Screenshot 3 Screenshot 4


Users can always fully customize the square footage and other parameters, such as family size, auto data, etc., if desired.
The estimates for Los Angeles change based on the Base City since the Geographic Assessor answers this question: In the Base (e.g., United States Average, Denver, San Francisco, Indianapolis), given an annual earnings of $50,000, what does it take to replicate the lifestyle in the Destination? Each Base has a unique lifestyle for a given earnings level; although the Destination is the same for each example, the lifestyle being replicated is different.
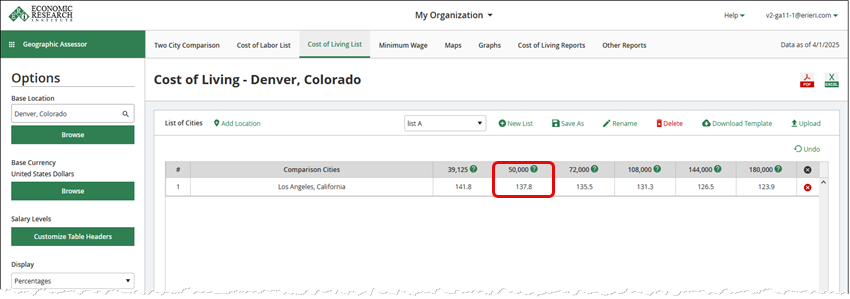
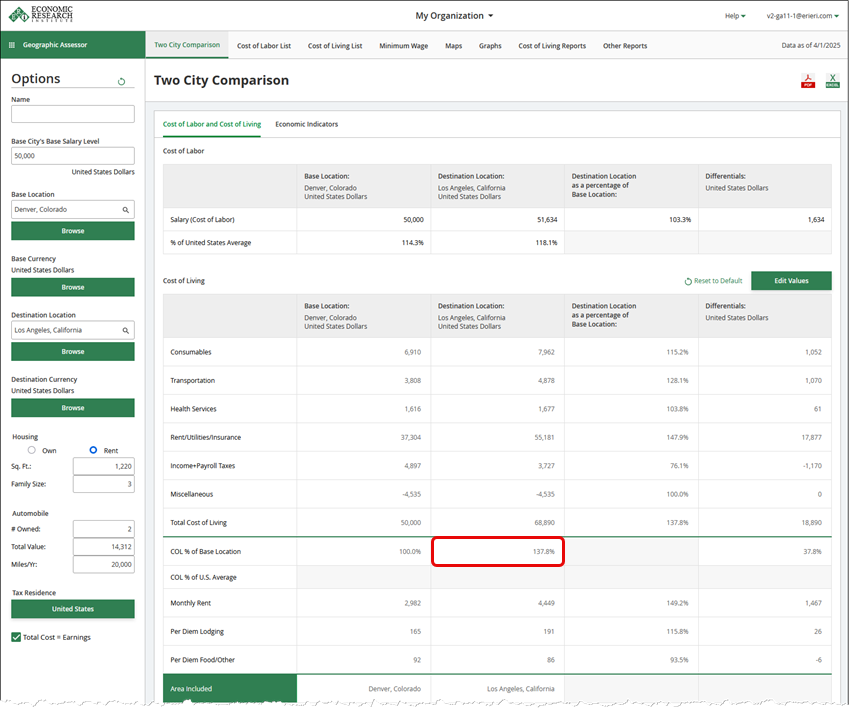
The updated Two City Cost Comparison and Cost of Living List always assume a local expenditure pattern. Estimates in the Cost of Living List (Screenshot 5) match those in the updated Two City Cost Comparison tab (Screenshot 6) when all benchmarks are used (the user enters only Annual Earnings level and does not customize square feet, family size, auto data, or own vs. rent).
Screenshot 5

Screenshot 6
