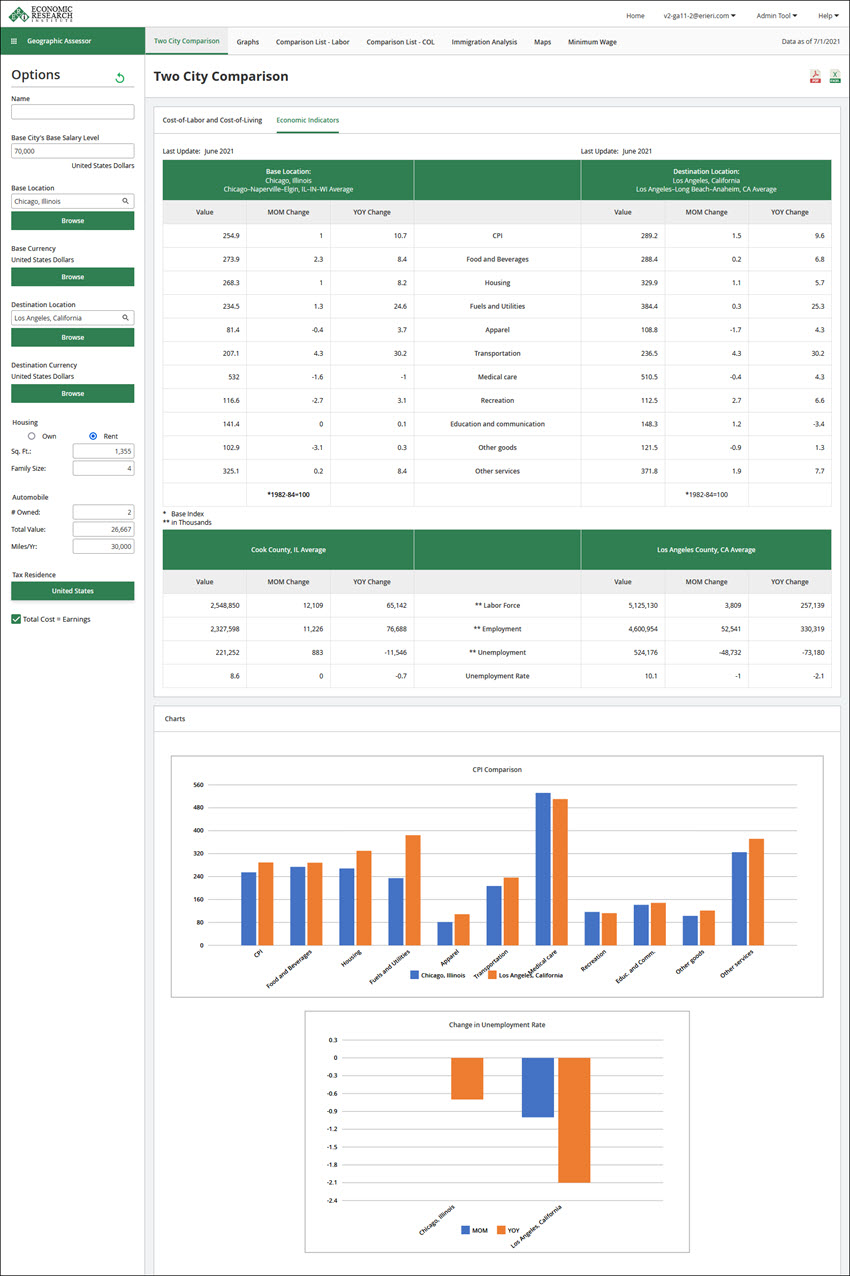
The Economic Indicators sub-tab in the Two City Comparison tab includes two tables describing Consumer Price Index (CPI) and labor statistics for the Base and Destination locations, plus a CPI YOY% Change chart and a Change in Unemployment Rate chart. Each table includes a column for Value, MOM Change (Month-over-Month Change), and YOY Change (Year-over-Year Change). Data in these tables and charts are static and only change with modifications to the Base and Destination locations.
Note: Economic Indicators data are not available for user-defined averages.
The Consumer Price Index (CPI) is a measure of the average change over time in the prices paid by urban consumers for a market basket of consumer goods and services. It is most widely used as a measure of inflation and provides information about price changes in the nation's economy to government, business, labor, and other private citizens, and is used by them as a guide to make economic decisions. Data updates are available every month for the United States and Canada. CPI data for other countries will be updated annually.
The first Economic Indicators table for CPI covers the following goods and services:
•FOOD AND BEVERAGES (breakfast cereal, milk, coffee, chicken, wine, full-service meals and snacks)
•HOUSING (rent of primary residence, owners' equivalent rent, fuel oil, bedroom furniture)
•APPAREL (men's shirts and sweaters, women's dresses, jewelry)
•TRANSPORTATION (new vehicles, airline fares, gasoline, motor vehicle insurance)
•MEDICAL CARE (prescription drugs and medical supplies, physicians' services, eyeglasses and eye care, hospital services)
•RECREATION (televisions, cable television, pets and pet products, sports equipment, admissions)
•EDUCATION AND COMMUNICATION (college tuition, postage, telephone services, computer software and accessories)
•OTHER GOODS AND SERVICES (tobacco and smoking products, haircuts and other personal services, funeral expenses)
The CPI table includes an index in the second to last last row. An index is used to measure movements in a numerical series. Typically, it has a reference base year/s for which the index level is set to 100. Changes to consumer prices are based on the value of 100 at the reference base year. For example, if the reference base is 1992-1994 equal to 100, then an index of 105 means that there has been a 5% increase in price since the reference period; similarly, an index of 90 means a 10% decrease.
The CPI table also includes a National Price Level Index on the last row. The National Price Level Index is the ratio of purchasing power parities to market exchange rates. It provides a measure of the differences in the general price levels between different countries using the US Average value as the base index. The National Price Level Index will be updated annually.
The second Economic Indicators table lists labor statistics by county or nation average. Data updates are available every month for United States and Canada. Labor data for other countries will be updated annually.
•LABOR FORCE (all persons in the civilian population classified as either employed or unemployed)
•EMPLOYMENT (all persons who during the survey period worked as paid employees of their own or a different business)
•UNEMPLOYMENT (all persons who were unemployed during the survey week)
•UNEMPLOYMENT RATE (ratio of unemployed to the civilian labor force expressed as a percent, that is, 100* [unemployed/labor force])
Data sources for the two Economic Indicators tables include the following:
•U.S. Bureau of Labor Statistics (BLS) Consumer Price Index: www.bls.gov/cpi
•U.S. BLS Current Population Survey (CPS): www.bls.gov/cps
•Statistics Canada Consumer Price Index & Labor Force Survey: www.statcan.gc.ca/eng
•International Monetary Fund (IMF) databases: www.imf.org

To Export to a PDF
See Export to PDF
To Export an Excel Spreadsheet
See Export to Excel
To Print
See Printing