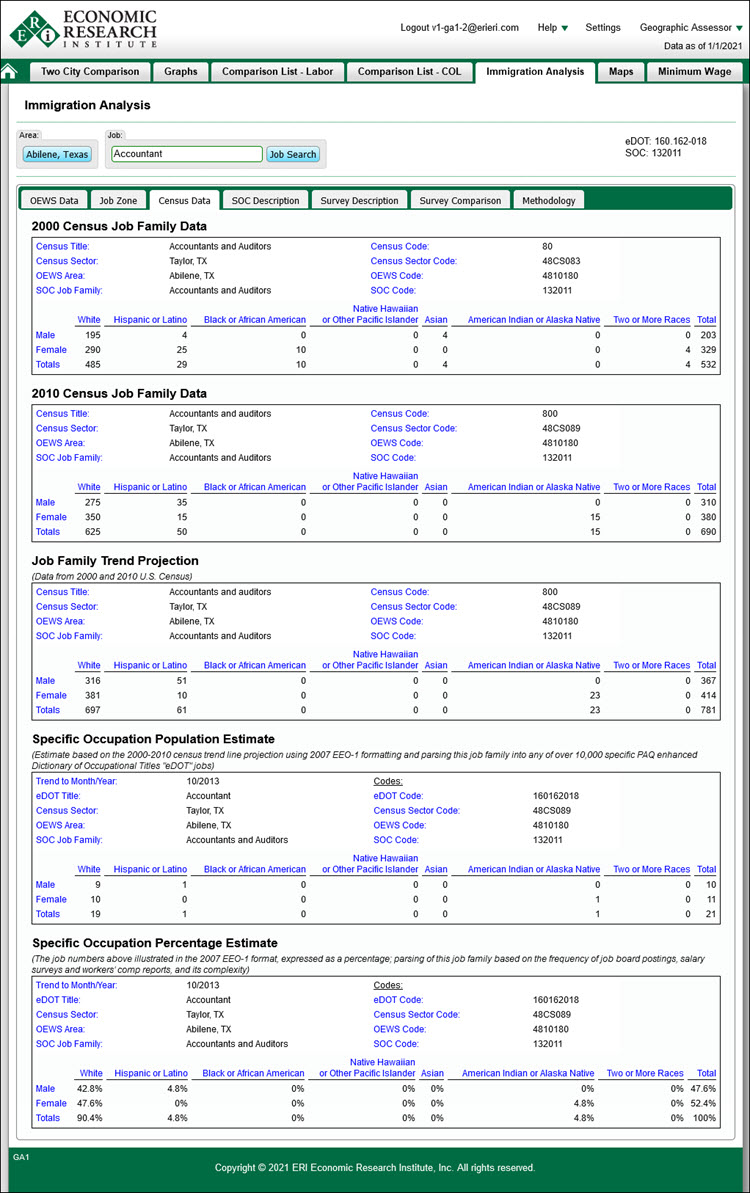
The Census Data tab provides estimates of OEWS job populations for specific Census Sectors.
Five tables are provided:
Table 1 - 2000 Census Job Family Data:
This table shows raw data from the 2000 Census utilizing the latest Census Sectors.
Table 2 - 2010 Census Job Family Data:
This table shows raw data from the 2010 Census utilizing the latest Census Sectors.
Table 3 - US Census (2000 – 2010) Job Family Trend Line Projection to Present Date:
This table illustrates population projections by job family, derived from a linear equation: 2000 to 2010, projecting each of the 6 values to the present month and year.
Tables 4 & 5 - Specific Occupation Projection (2000 – 2010 Trend Line Projected to Present Date):
This table illustrates specific job (vs. job family) population estimates based on the 2000-2010 trend line projection (table 3). Specific Occupation projections are created by using ERI's complexity model and Job Availability Survey results to create an estimated percentage of the number of incumbents in the specific job within the job family (as compared to all other specific jobs within that same job family). These are estimates. Table 4 displays the data in a percent format. Table 5 displays the data in a population count format.
See Immigration Analysis Background for related information.
