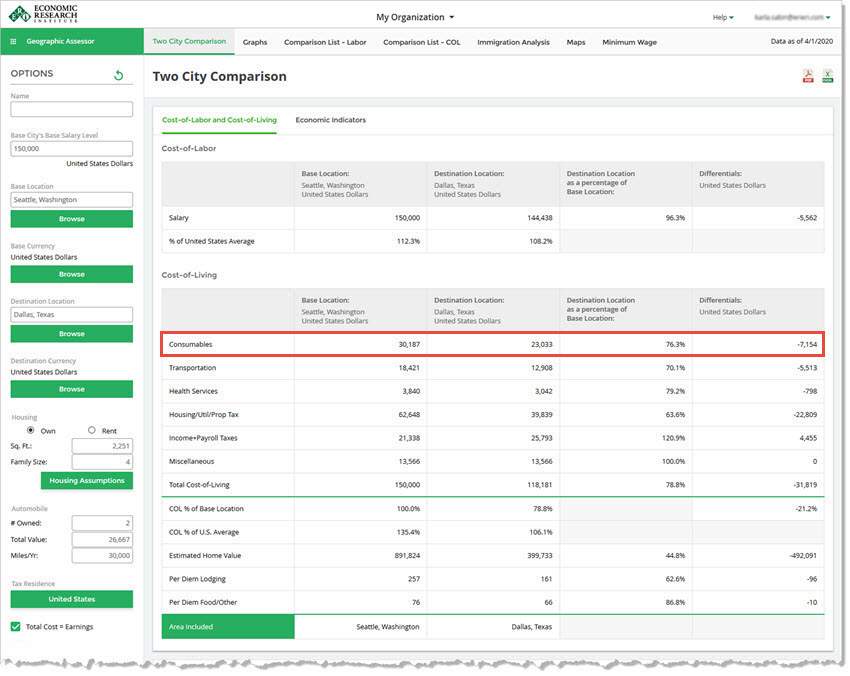
The percentage of income dedicated to Consumables varies by income level and family size, and is calculated for the Base City spending pattern after housing and income tax spending has been assigned. Area consumables spending is based upon North American disposable income spending patterns at different earnings levels (inefficient purchasing in international locations).
Expenditure figures for Consumables are built up from a market basket of goods and services that a typical management/professional household would purchase and consume. The market basket of goods and services uses survey data from items that represent categories of goods and services (i.e., proxy goods). For example, ground beef could be the item that represents red meat in the market basket. The assumption is that, if the price of a specific amount of ground beef is 15% above the National Average, then the price of all red meat is approximately 15% above the National Average. The National Average is the average for that item during that sampling period only. Each item contributes a specific share (weight) to the market basket. Studies conducted by the Bureau of Labor Statistics’ Consumer Expenditure Survey are used by ERI researchers to determine the weights assigned in the Geographic Assessor model. The specific weights allocated to each component of the Consumables portion defines a management/professional standard of living. Consumables prices are surveyed only from grocery and retail stores where management/professional households would normally shop. Similarly, only establishments in which management/professional households typically purchase services are surveyed.
The following categories of goods and services are collected for use in the Consumables price index modeling: Meats, Dairy Products, Produce, Bakery Products, Miscellaneous Grocery Products, Miscellaneous Goods and Services (Fast Food, Average Casual Restaurant, Haircut and other personal services, Clothing items, Entertainment, Major Appliance Repair, etc.).
It is prohibitively expensive to collect price data in every one of the over 9,000 locations in the ERI database. ERI researchers have developed a theoretical econometric model that identifies important determinants of the cost of living in a specific location. This algorithm is used to estimate prices in locations where survey data is not collected.
Please Note: All state and local sales tax estimates, Canadian Goods and Services Tax (GST), Harmonized Sales Tax (HST), and Provincial Sales Tax (PST) estimates and Value Added Tax (VAT) estimates are included in the Consumables estimates.

See Two City Comparison - Background for more information.